The essay in brief
In a 2006 Policy Review essay, Nicholas Eberstadt argued that the official U.S. poverty rate no longer measures the fixed level of hardship it was designed to track. It rose after 1973 while incomes, schooling and antipoverty spending grew, and low-income households came to spend far more than their reported incomes, so he called for replacing it with better indicators.

Between 1973 and 2001, real per capita income in the United States rose by roughly 60 percent and government spending on means-tested programs more than tripled. Over the same years, the official poverty measure (OPM) reported that the share of people in poverty went up, from 11.1 to 11.7 percent.
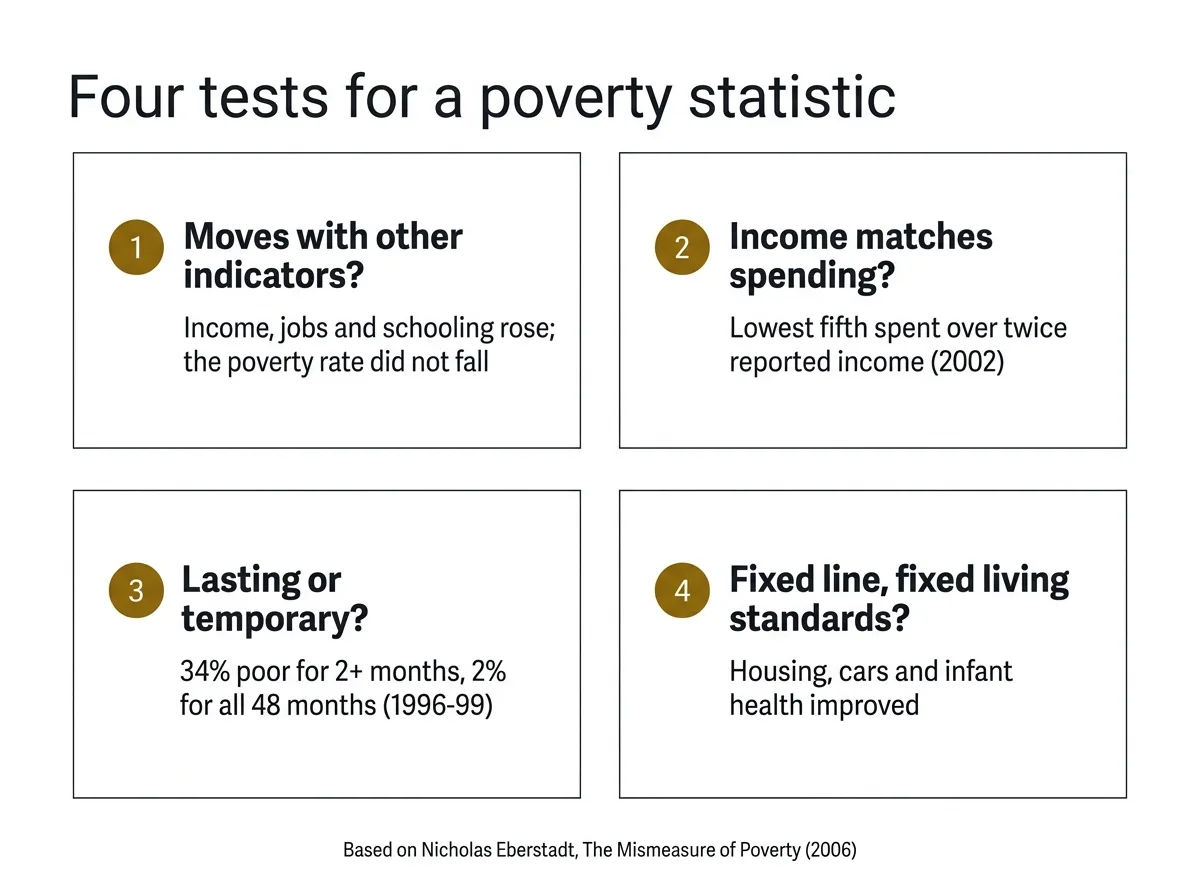
Nicholas Eberstadt, a political economist at the American Enterprise Institute, a Washington think tank, used that puzzle to open “The Mismeasure of Poverty” in *Policy Review* No. 138 (August and September 2006). His claim: the number no longer tracked what it was built to track. This guide sets out his case as four tests a poverty statistic should pass.
The argument in brief
- The OPM was designed in the 1960s as an absolute measure, a fixed line adjusted only for inflation.
- Since the early 1970s it has moved against almost every other indicator of well-being, including what low-income households spend.
- It therefore misleads, and should give way to a better index or a set of indices.
Eberstadt granted that relative deprivation matters and that progress for people at the bottom could still fall short. His question was whether one statistic measures what it says it measures.
How the measure was built
Mollie Orshansky, an economist at the Social Security Administration, published the original poverty thresholds in 1965. She took the cost of the Agriculture Department’s cheapest food plan and multiplied it by about three, because a 1955 survey showed families spending roughly a third of their budget on groceries. In 1969 the Bureau of the Budget made her thresholds the government’s statistical definition of poverty. Orshansky called her line “admittedly arbitrary.”
The design has changed little. According to the Census Bureau’s guide to how it measures poverty, the official measure compares the family’s pretax money income with one of 48 poverty thresholds, which vary by family size and age. If income falls below the poverty threshold, every member of the family has poverty status. The same thresholds are used nationwide and updated annually using the Consumer Price Index. Capital gains, tax credits and noncash assistance, for example food stamps, do not count. The estimates come from the Current Population Survey’s Annual Social and Economic Supplement.
Test 1: Does it move with other indicators?
Eberstadt compared the OPM with four things that should push need down in any modern economy: income, employment, education and antipoverty spending. All four moved the right way after 1973. The share of adults without a high school diploma fell from nearly 40 percent to under 16 percent.
Yet in his regressions for 1972 to 2002, more schooling and more spending went with more measured poverty. Unless all four data series were wrong, he concluded, the measure was the problem.
Test 2: Does income match spending?
The official measure assumes that what a household earns in a year equals what it spends. Consumer Expenditure Survey data from the Bureau of Labor Statistics showed a widening gap at the bottom:
- 1960 to 1961: the lowest quarter of households spent about 12 percent more than their pretax income.
- 1972 to 1973: the lowest fifth spent nearly 40 percent more.
- 2002: the lowest fifth spent more than double their reported income.
He noted that their net worth had not fallen, so in his view debt did not explain the gap.
Test 3: Does it separate lasting poverty from a bad year?
Eberstadt’s explanation was income volatility. Since Milton Friedman, economists have argued that households spend according to expected long-run income, so a middle-class family in one bad year is counted as poor while they keep spending much as before.
Census panel data showed how common such spells are. From 1996 to 1999, about 34 percent of the population spent at least two months below the poverty line, but only 2 percent stayed below it for all 48 months. Work by Jacob Hacker and Robert Moffitt suggested that annual swings in earnings had grown since the 1970s, most of all for families near the bottom.
Test 4: Does a fixed line mean fixed living conditions?
If the line marks the same hardship every year, life below it should look the same over time. Eberstadt found steady gains instead.
| Area | Earlier | Later |
|---|---|---|
| Crowding | About 27 percent of households in poverty overcrowded (1970) | About 6 percent (2001) |
| Transport | Nearly three-fifths of the lowest fifth had no car (1972 to 1973) | Nearly three in four households in poverty had a vehicle (2003) |
| Infant health | 20 deaths per 1,000 live births (1970) | 7 per 1,000 (2002) |
| Dental care | Nearly two-thirds of adults in poverty had untreated cavities (1971 to 1974) | About two-fifths (1999 to 2000) |
Fewer low-income children were underweight in 2003 than in 1973, even though the OPM said poverty among children had risen.
Context and reception
The essay came about a decade after a National Academy of Sciences panel recommended a new way to measure poverty in 1995. Eberstadt later expanded it into a book, *The Poverty of “The Poverty Rate”* (AEI Press, 2008). The economists Bruce Meyer and James Sullivan have since built consumption-based estimates that show a much larger long-run decline than the official figures.
Critics do not all agree with him about what is wrong:
- Many analysts argue the thresholds are too low, since a line built on 1960s grocery budgets ignores what rent, child care and medical bills cost today.
- Supporters of relative measures say poverty means falling far behind one’s own society, so better appliances do not settle who is poor.
- Survey specialists note that expenditure surveys are much smaller than income surveys, which makes consumption estimates hard to produce for states and small groups.
How the essay has held up
The measure was not discarded. Since 2011 the Census Bureau has also published the Supplemental Poverty Measure (SPM). It counts noncash benefits and refundable credits, subtracts taxes and costs such as work expenses and medical bills, and sets thresholds from current spending on basic needs. It does not replace the official measure. Many assistance programs still set eligibility using the HHS poverty guidelines, a simplified version of the official thresholds.
For 2025, the Census Bureau reported an OPM rate of 10.2 percent and a supplemental rate of 13.1 percent. Whether one year’s earnings are a fair guide to living standards at the bottom is still argued.
A checklist for reading any poverty number
- Absolute or relative: is the line fixed in real terms, or does it move with typical living standards?
- Resources: does it account for taxes and noncash benefits?
- Income or consumption: one low year is not the same as a low standard of living.
- Duration: does the figure count brief spells or lasting poverty?
- Cross-checks: do housing, health and spending data point the same way?
Questions readers often ask
What is the official poverty measure?
It is the federal statistical definition of poverty, published by the Census Bureau. It compares pretax cash income with thresholds based on Orshansky’s 1960s formula.
What is the difference between the OPM and the SPM?
The OPM counts only pretax cash, so SNAP, rent subsidies and Medicaid are left out. The supplemental poverty measure counts benefits such as SNAP and rent subsidies, subtracts necessary costs and adjusts its thresholds by region.
Did Eberstadt want less spending on the poor?
The essay does not argue that. He wrote that anyone who wants effective antipoverty policy should want accurate information about need.
Where to read the original essay
The full text of Nicholas Eberstadt, “The Mismeasure of Poverty,” *Policy Review* No. 138 (August and September 2006), with his tables and notes, is in the Hoover Institution’s archive.
Sources
- Nicholas Eberstadt, "The Mismeasure of Poverty", Policy Review 138 (2006)
- U.S. Census Bureau: How the Census Bureau Measures Poverty
- U.S. Census Bureau: Poverty in the United States: 2025 (P60-290)
- Mollie Orshansky, "Counting the Poor: Another Look at the Poverty Profile", Social Security Bulletin 28:1 (1965)
- Nicholas Eberstadt, The Poverty of "The Poverty Rate": Measure and Mismeasure of Want in Modern America (AEI Press, 2008)
- NBER Digest: Five Decades of Poverty (Meyer and Sullivan)